

Open Office 365 reports from directly in Excel and get your Exchange Online reporting!
Predefined reports in the Office 365 Admin Portal are fine for overview, however, if you require more granularity then Office 365 reporting has to be performed via PowerShell or some other development language to access the Office 365 Exchange Online reporting service. Custom reports are very flexible where you can specify how the data is sorted, grouped and retained. PowerShell is less user friendly when looking for output, especially if you want to set reports as jobs and export the data to your own control panel or support dashboard.
But what if you want full reporting without having to create custom scripts, which are complex and time consuming? Luckily if you’re a little more capable with Excel this can be achieved reasonably easily and without the need to learn an entirely new process. In order to get those juicy reports all you have to do is:
1. Start by opening a new sheet in Excel. On that worksheet, click Data:

2. Click From Other Sources, and then click From OData Feed.

3. That brings up the Data Connection Wizard dialog box. On the Connect to a Data Feed dialog, enter the reporting service URL: https://reports.office365.com/ecp/reportingwebservice/reporting.svc/ as the data feed location. You will need to enter Administrator credentials with the necessary permissions. Click Next.

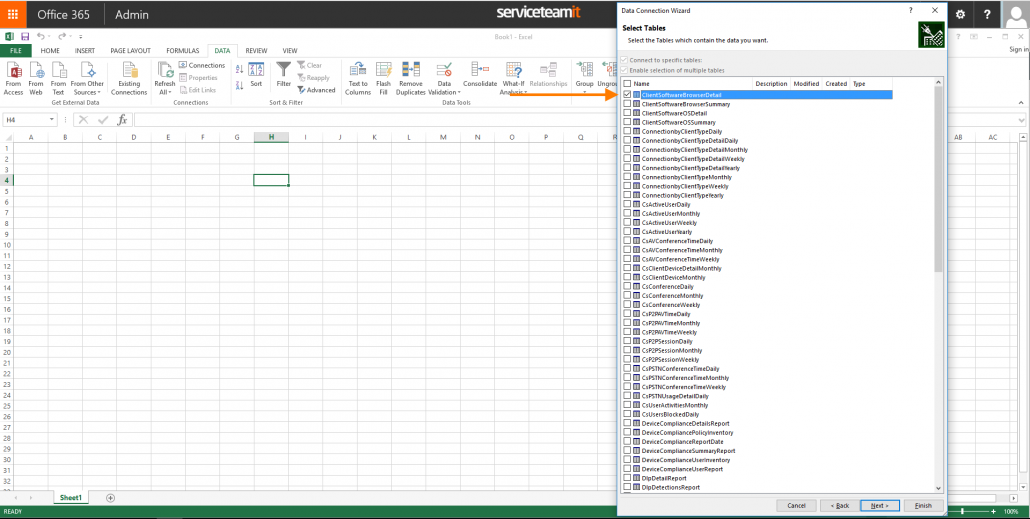
4. After your user and password has been authenticated you will see the Select Tables dialog. Select a report, here I have chosen ClientSoftwareBrowserDetail, then click Next. Note that it is possible to select multiple reports which results in multiple tables and charts or to create a single table and chart that combines all of the data.

5. Now you should see the Save Data Connection File and Finish dialog. You can opt to save the password in the file, but this is not recommended. Click Finish.

6. Finally you will be presented with the Import Data dialog box with options of how to view the data and where to put it. Make your choices and click OK.

The options for handling the data are vast! Perhaps create an Excel Services Dashboard using the OData feed, filtered and sliced, and publish it to your SharePoint server? From SharePoint you could export as XML to a custom monitoring tool or push the feed data to an SQL Server for your support system?
If you have any questions or need a little more in-depth help please get in touch.


Leave a Reply
Want to join the discussion?Feel free to contribute!